data
driven
drawing.
- vol.5 - [Dec 17th 2015] with Women Who Code Tokyo, co-hosted by US Embassy.
- vol.4 - [Nov 7th 2015] at Code for Japan Summit.
- vol.3 - [Oct 30th 2015] Media Lab. at Aalto University in Helsinki, Finland. (lecture only).
- vol.2 - [Sep 27th 2015] at dots.(shared space in Shibuya, Tokyo)
- vol.1 - [Jun 20th 2015] with Shibuya University (NPO organization).


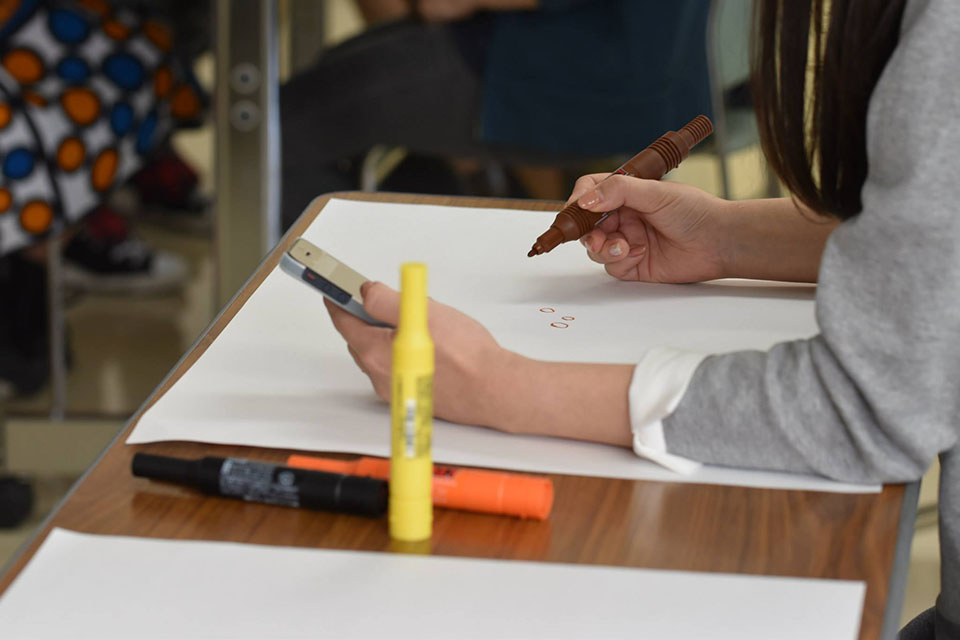
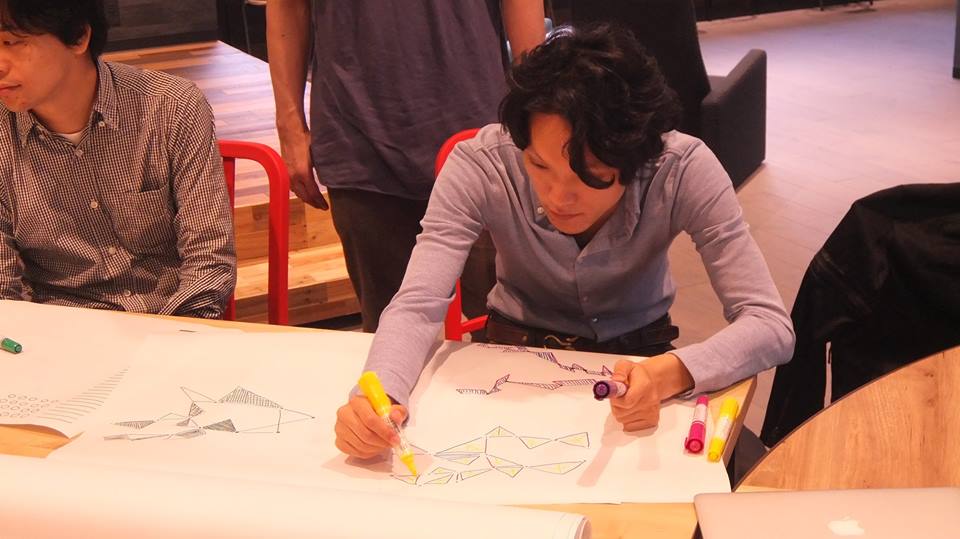
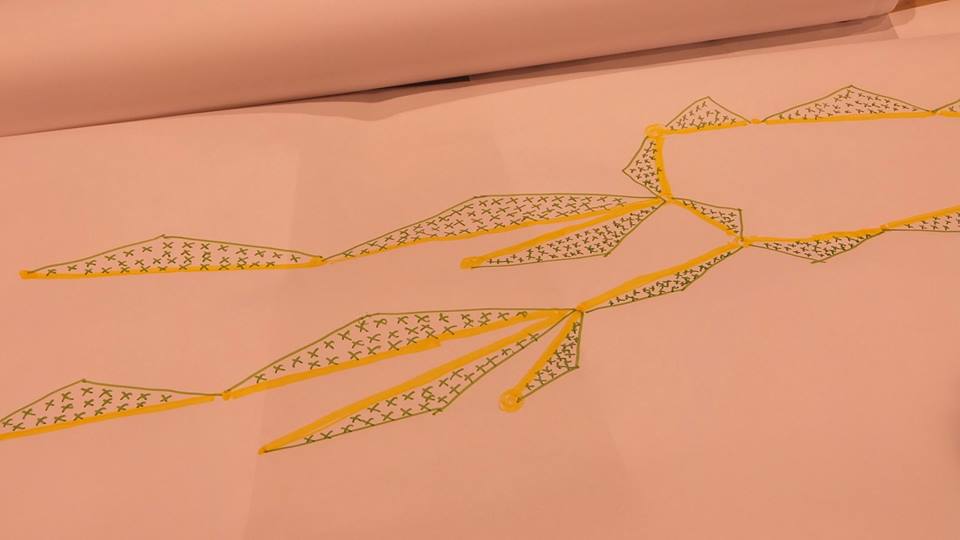
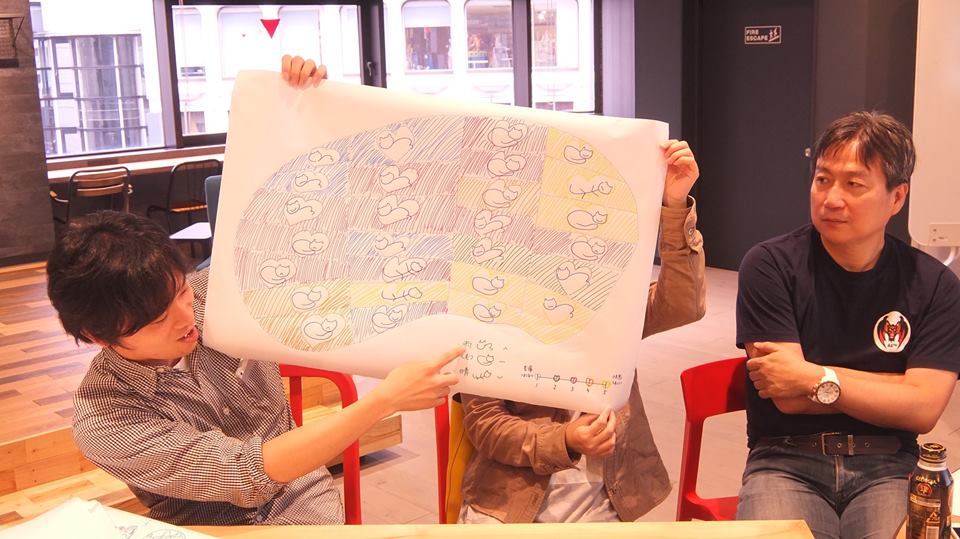
we use pens, paper & Processing. I mean d.d.d by p.p.p :-)
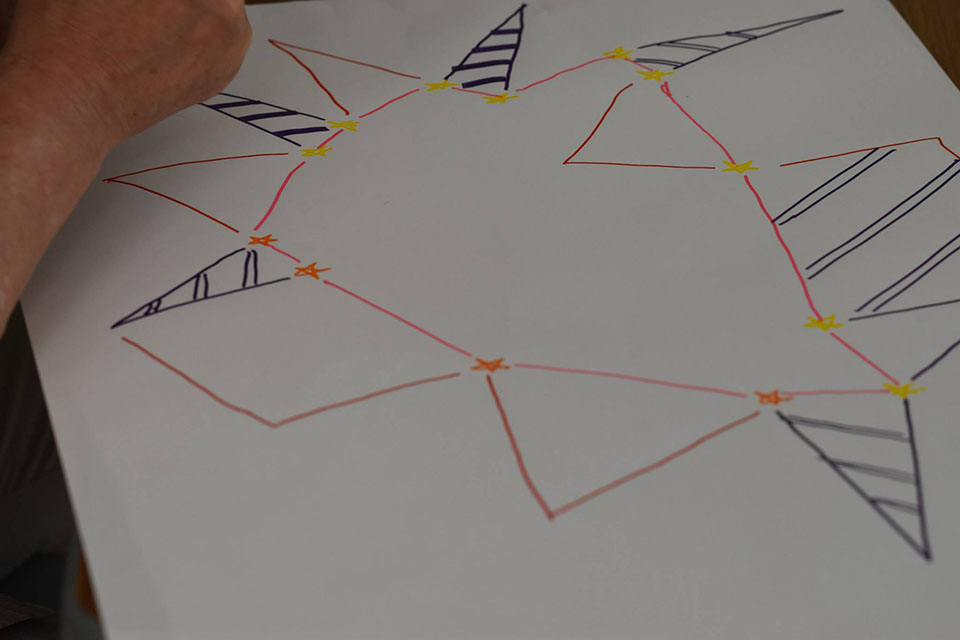
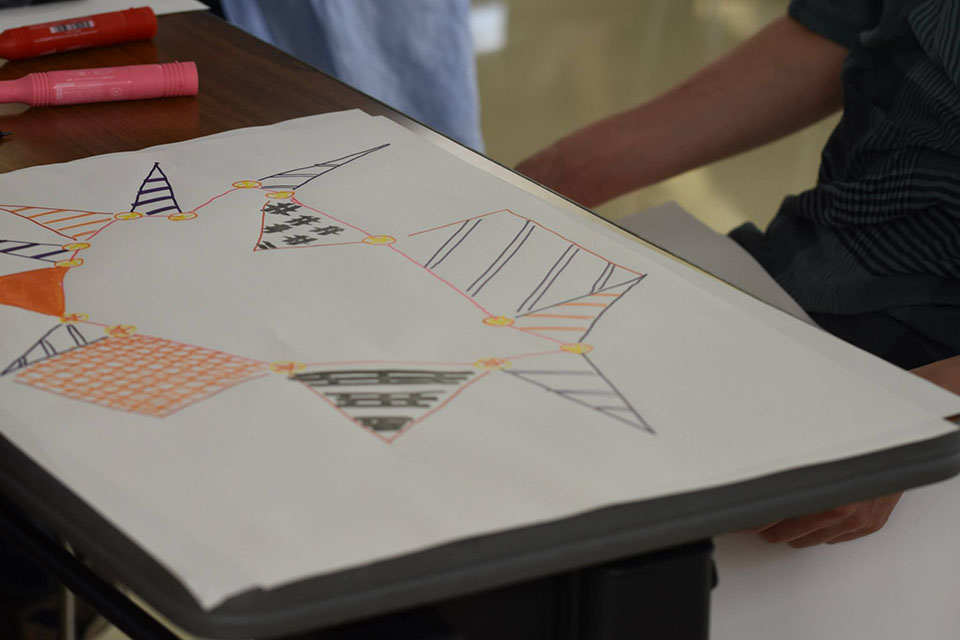
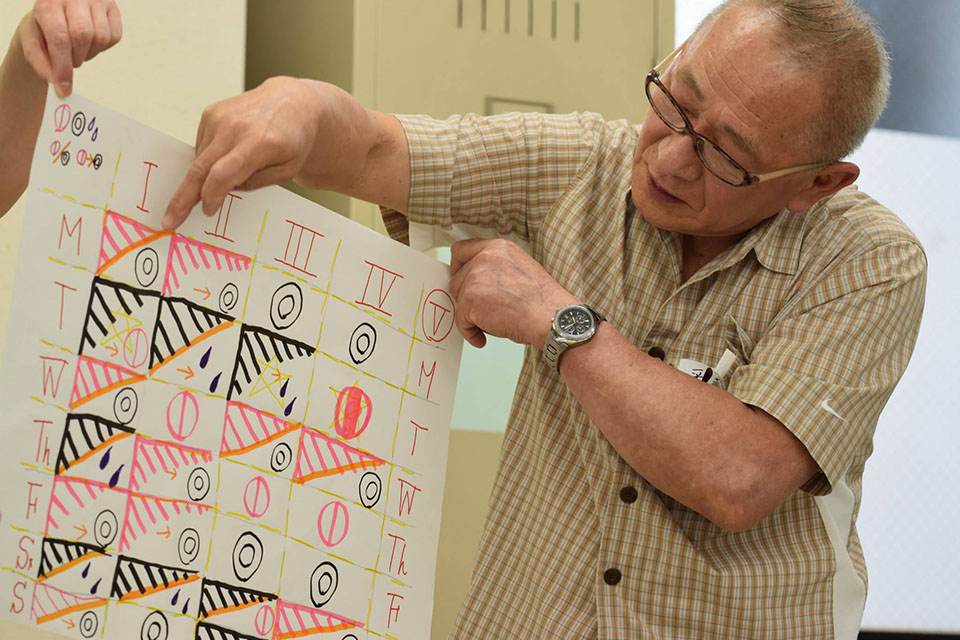
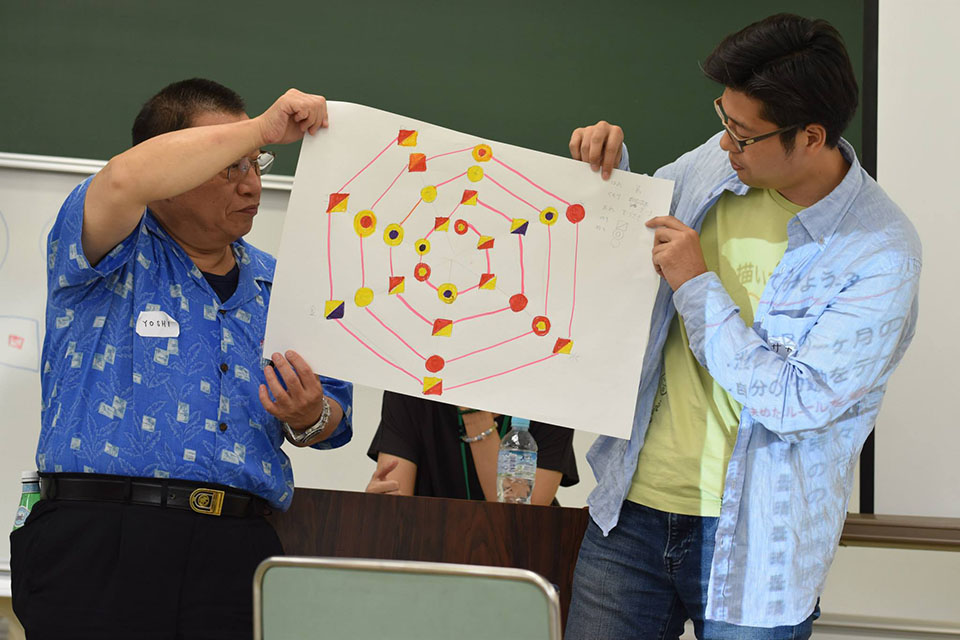
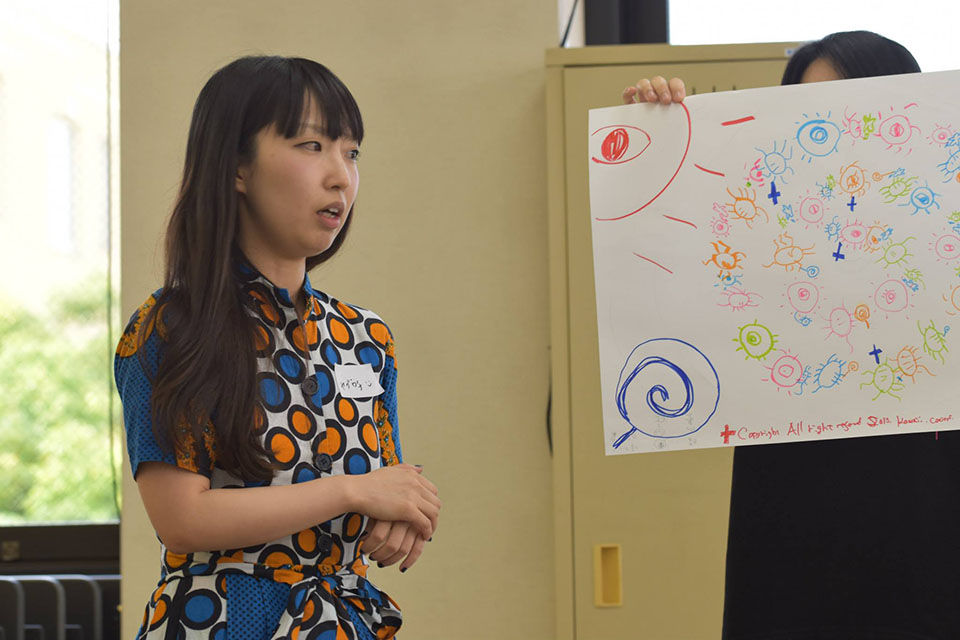
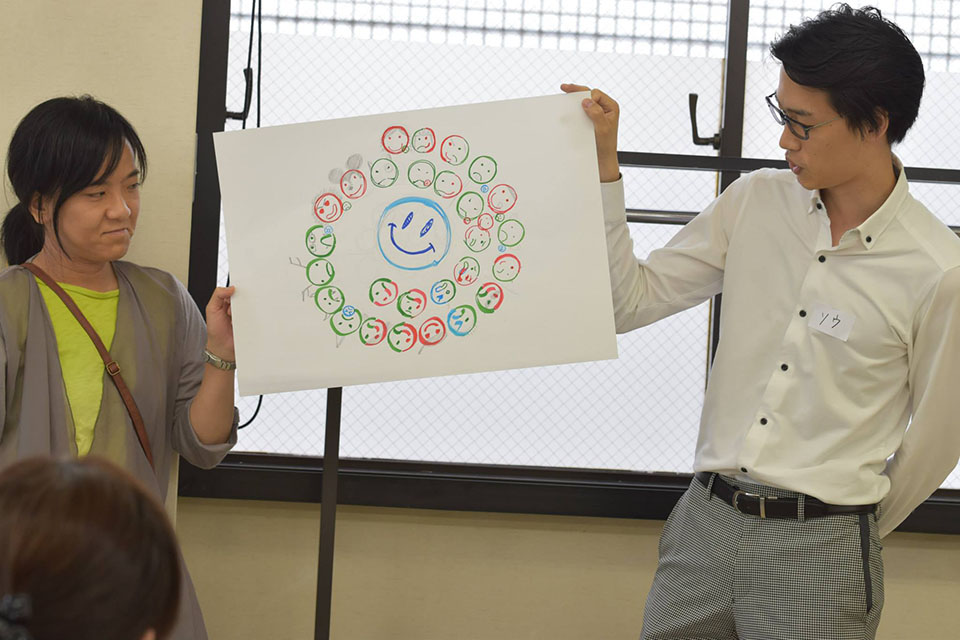
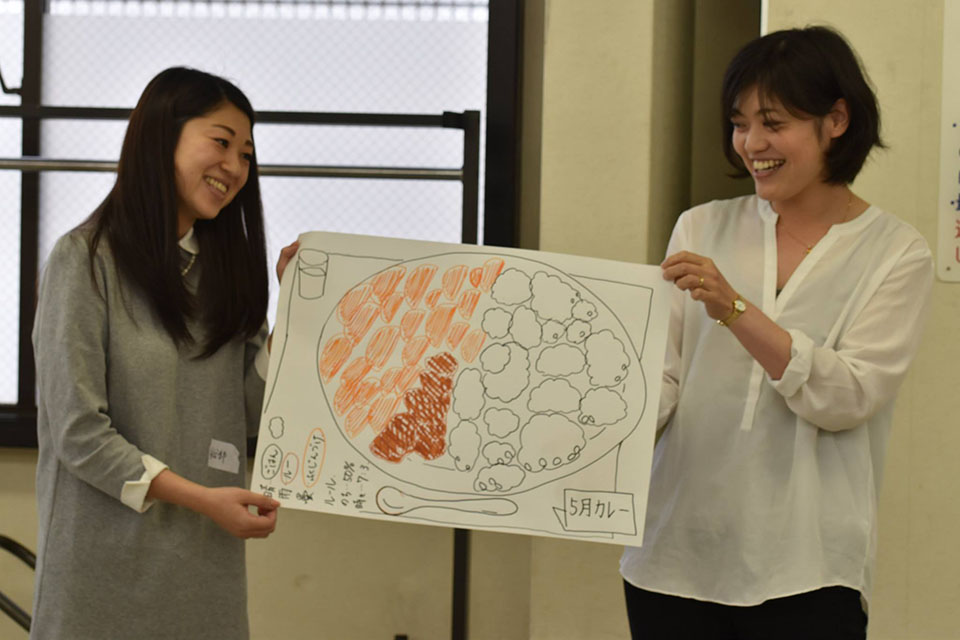
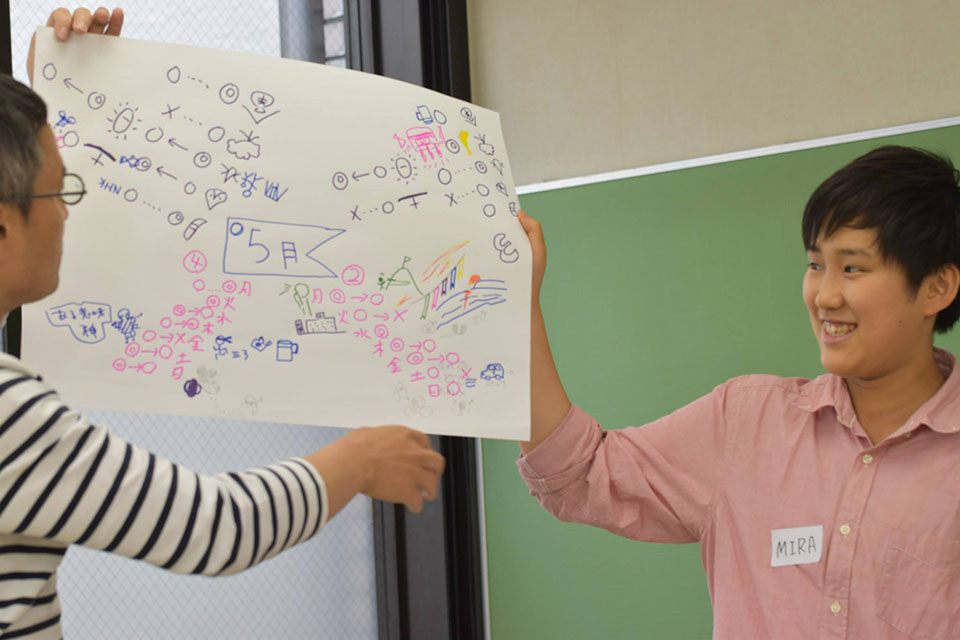
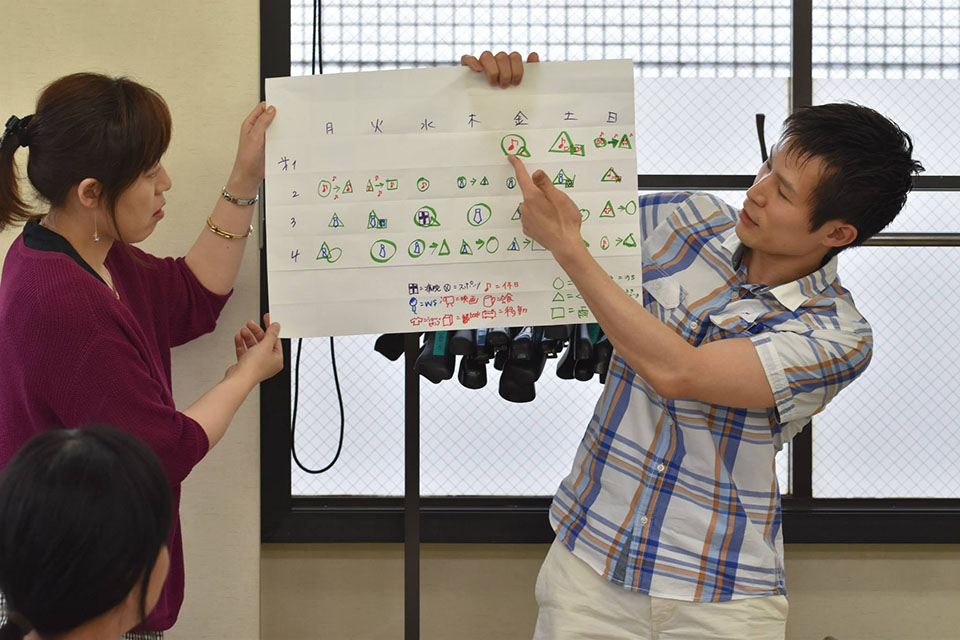
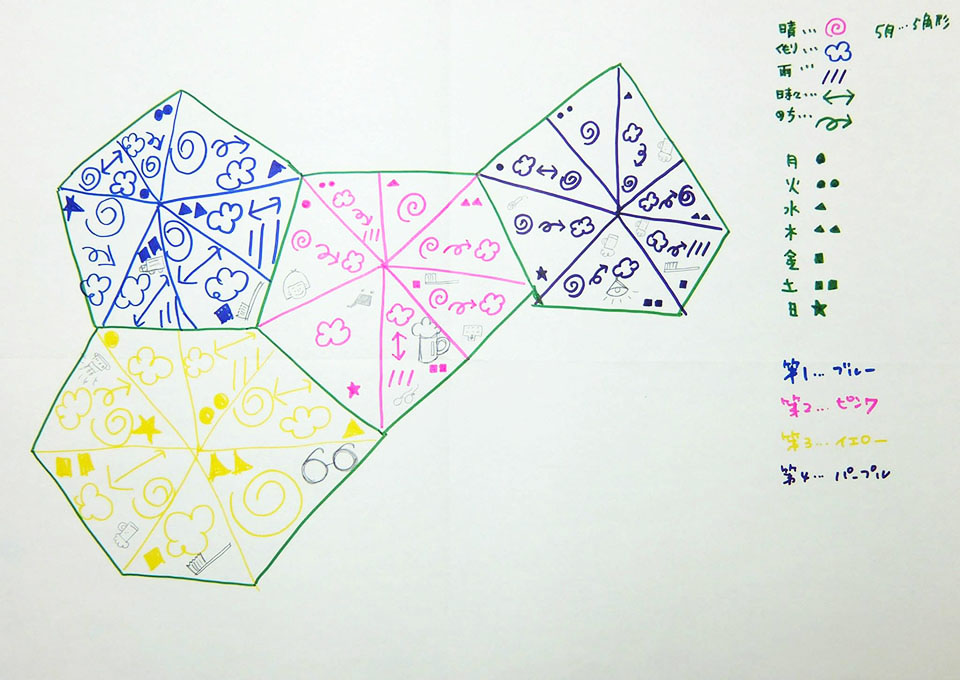
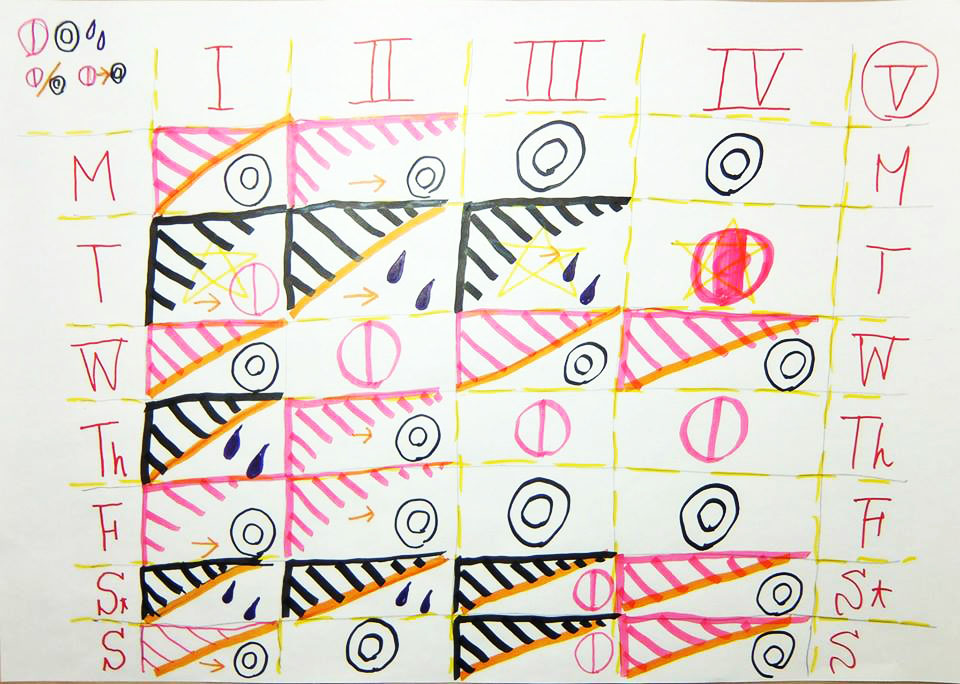
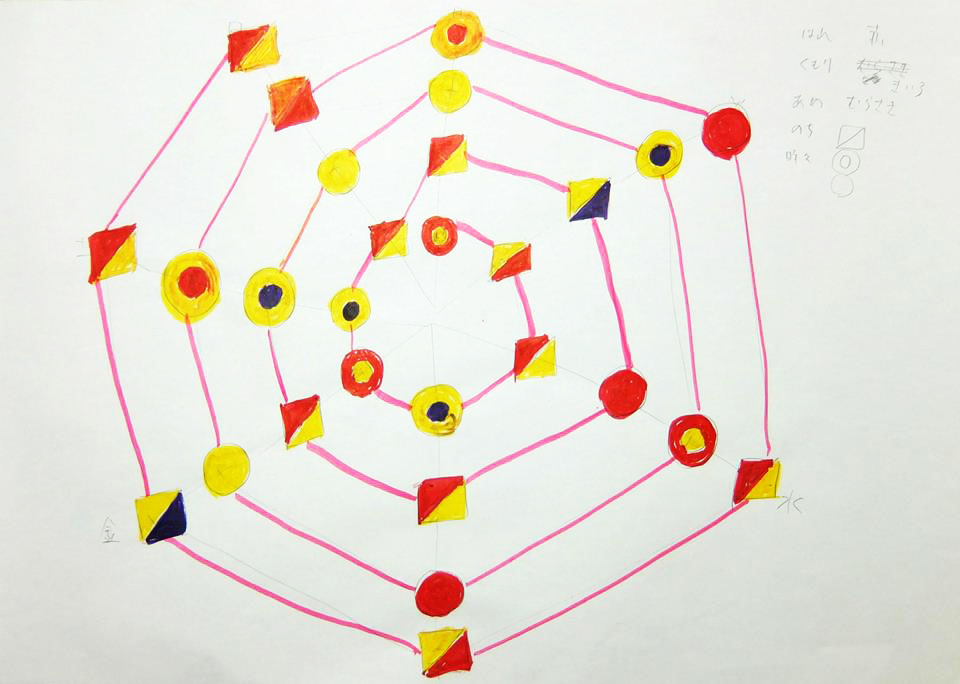
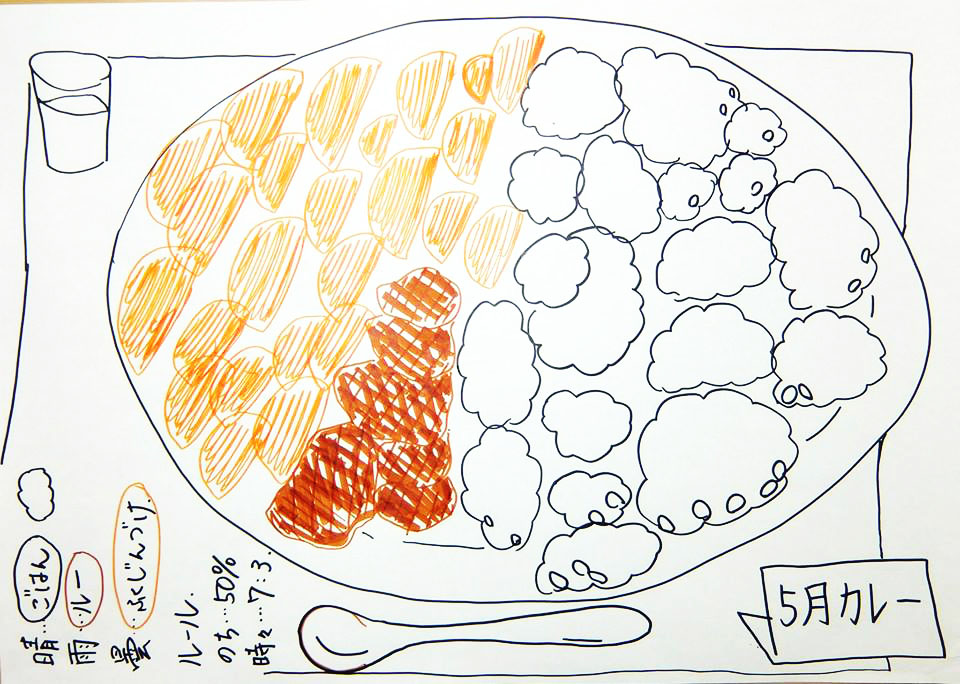
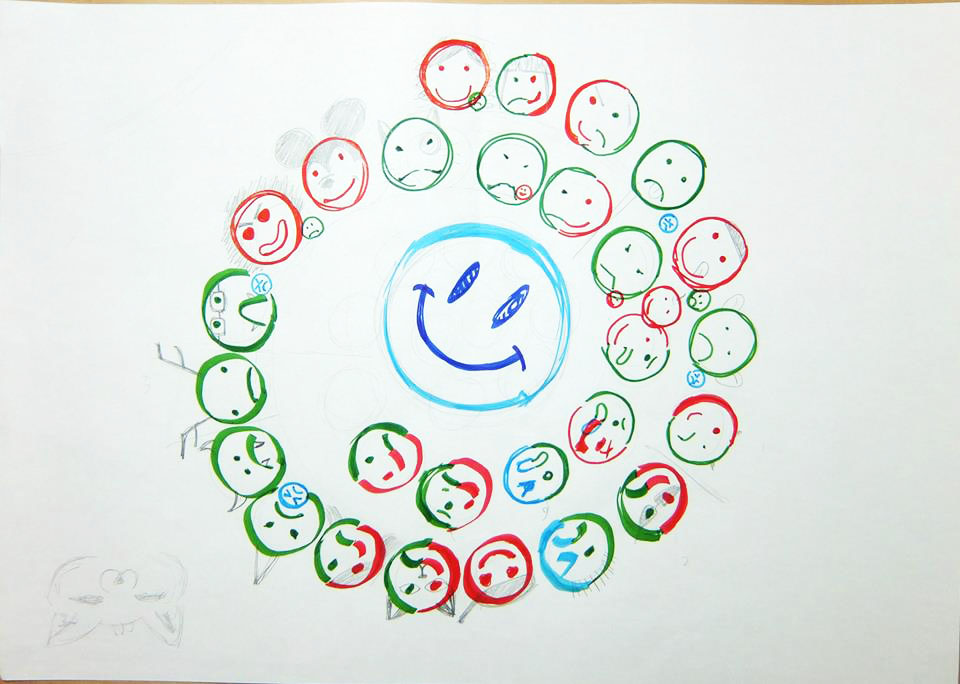
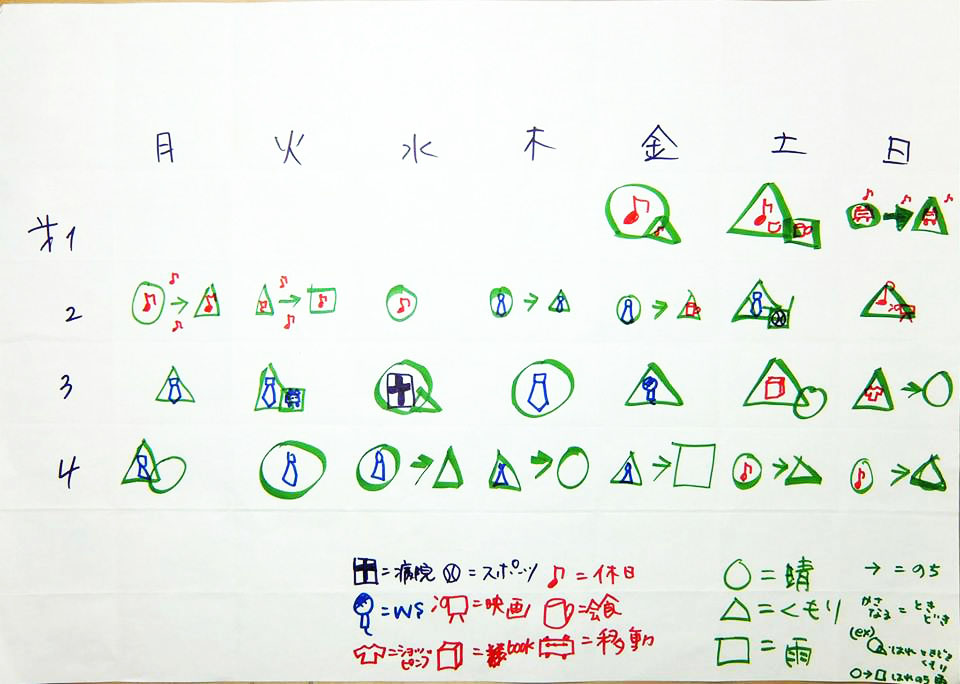
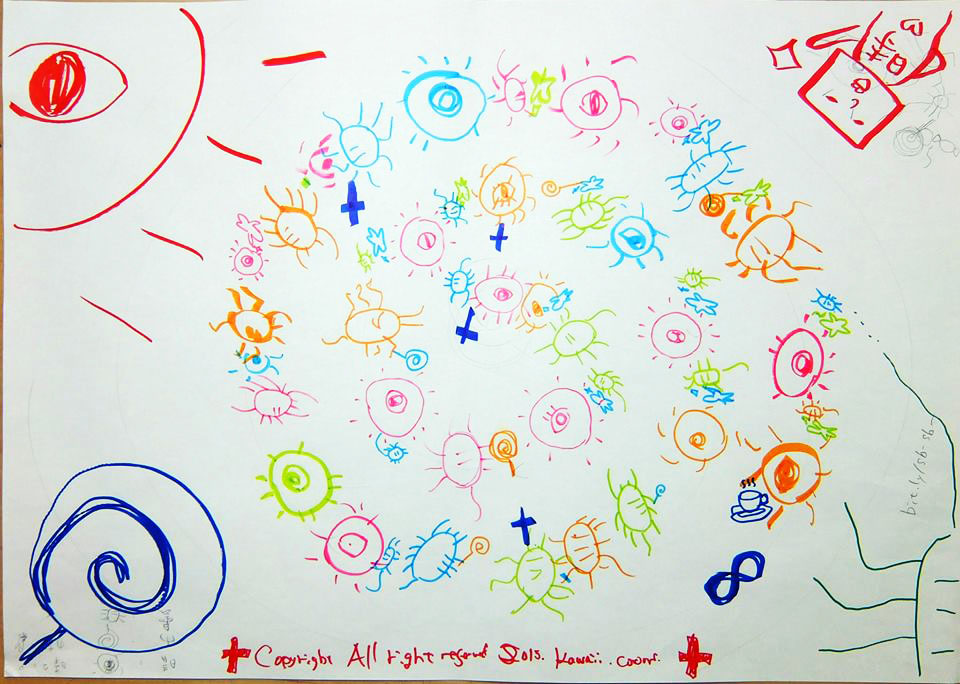
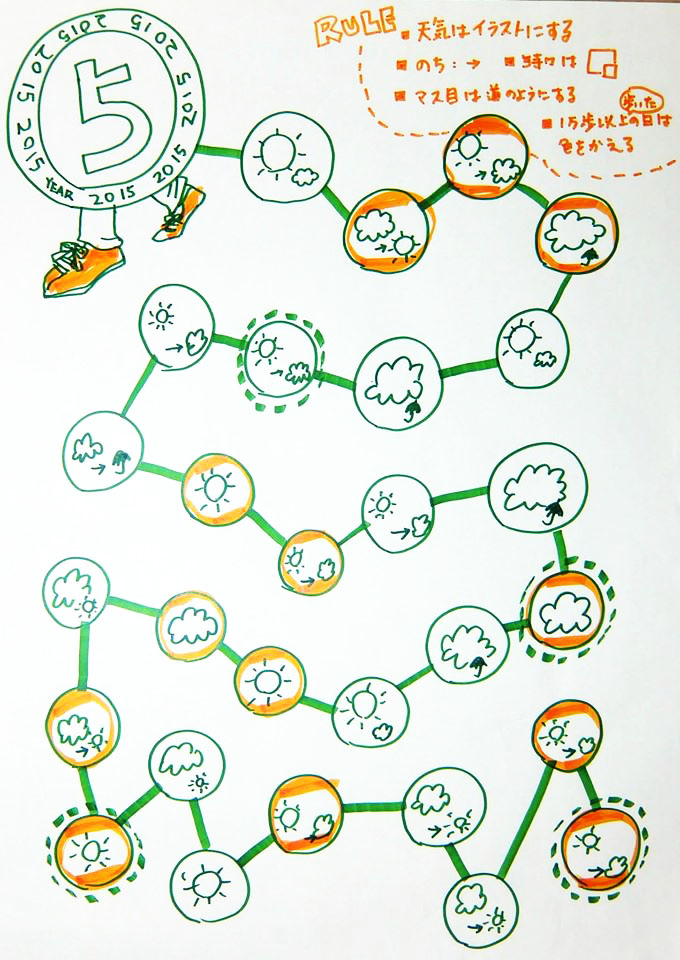
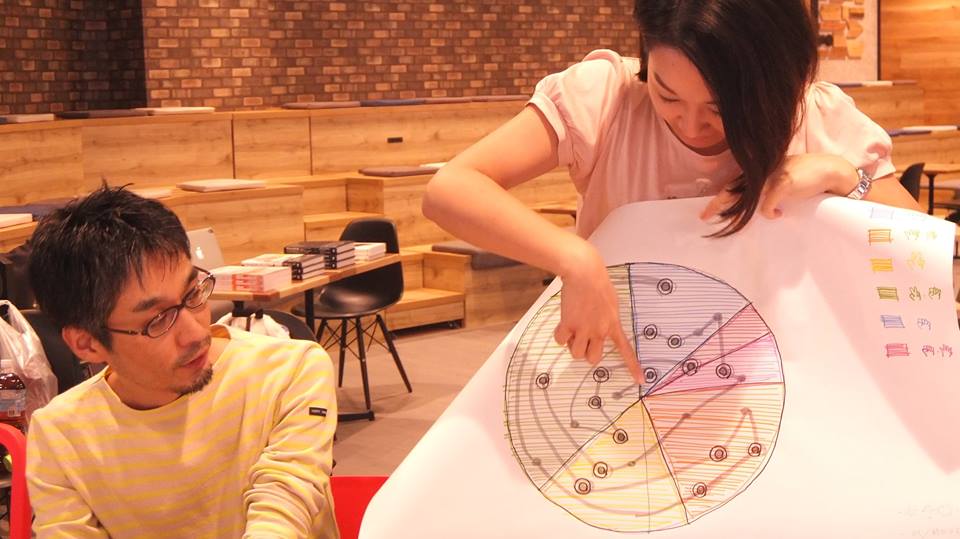
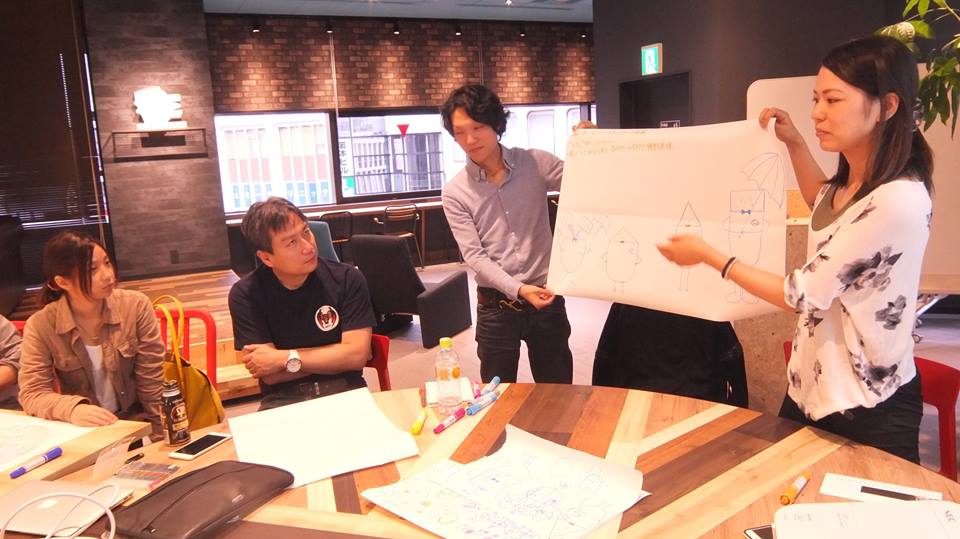
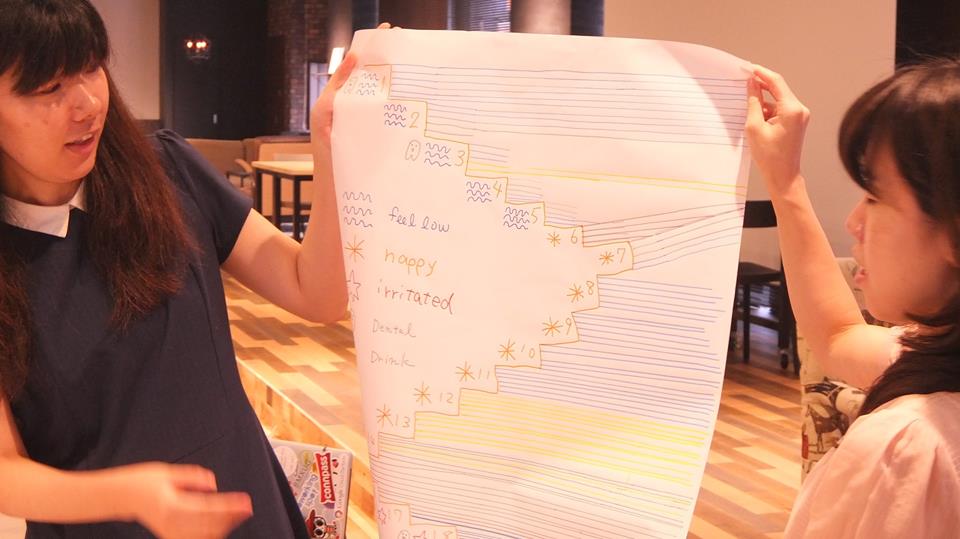
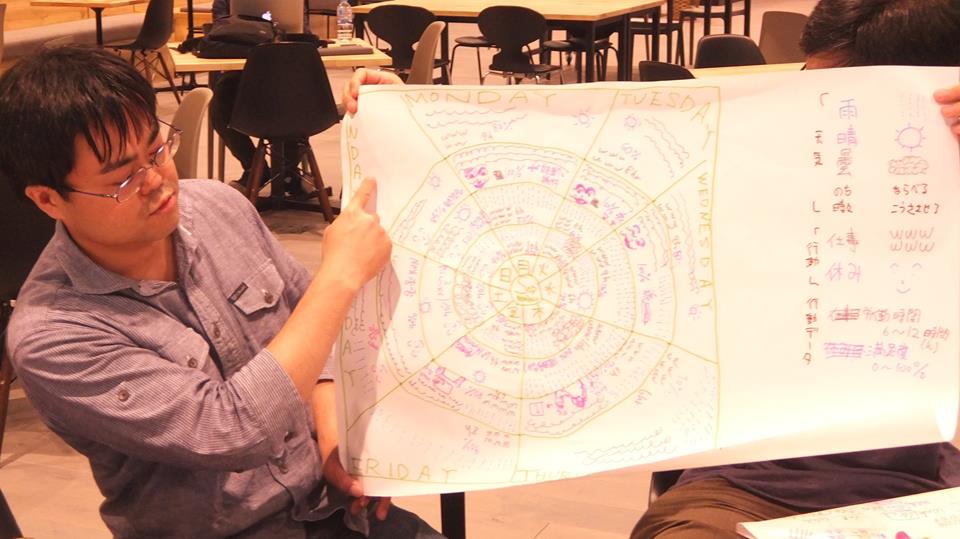
Drawing a picture of data. By hand. By programming.
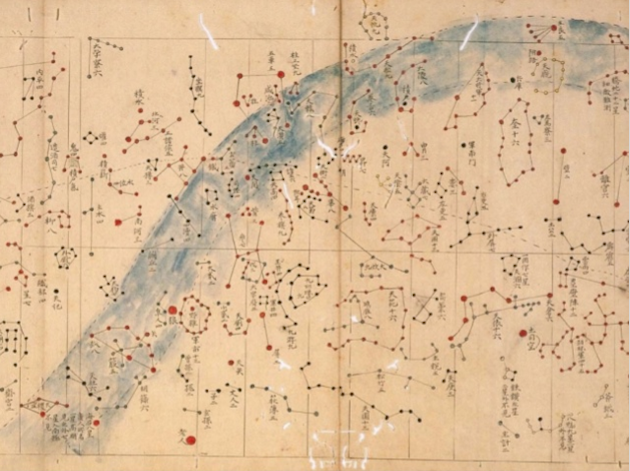
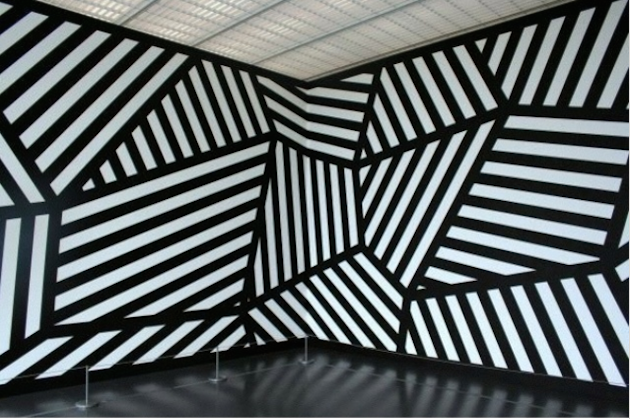
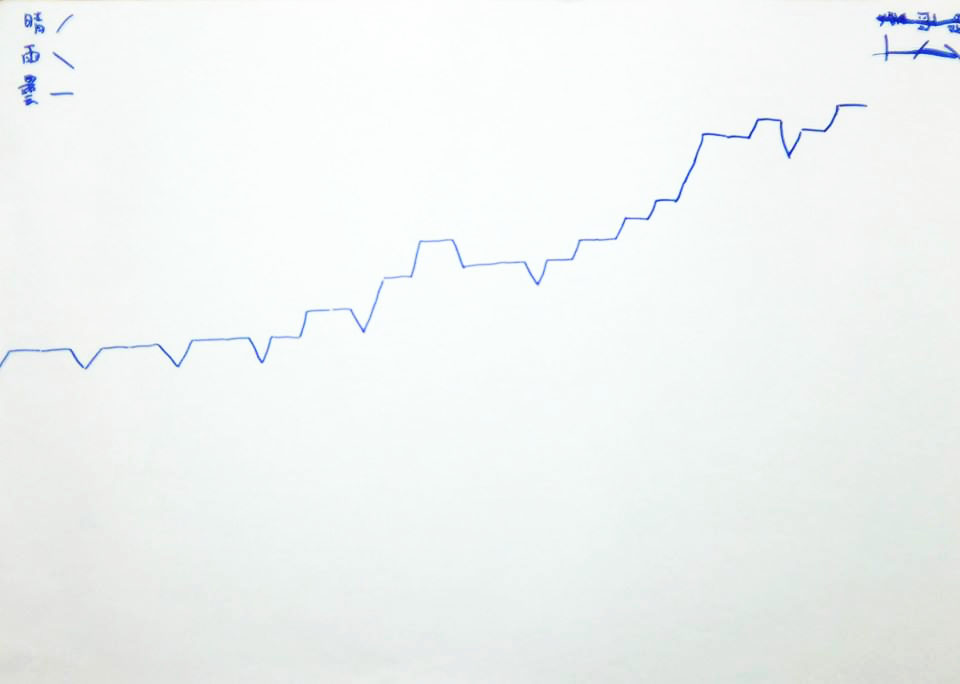
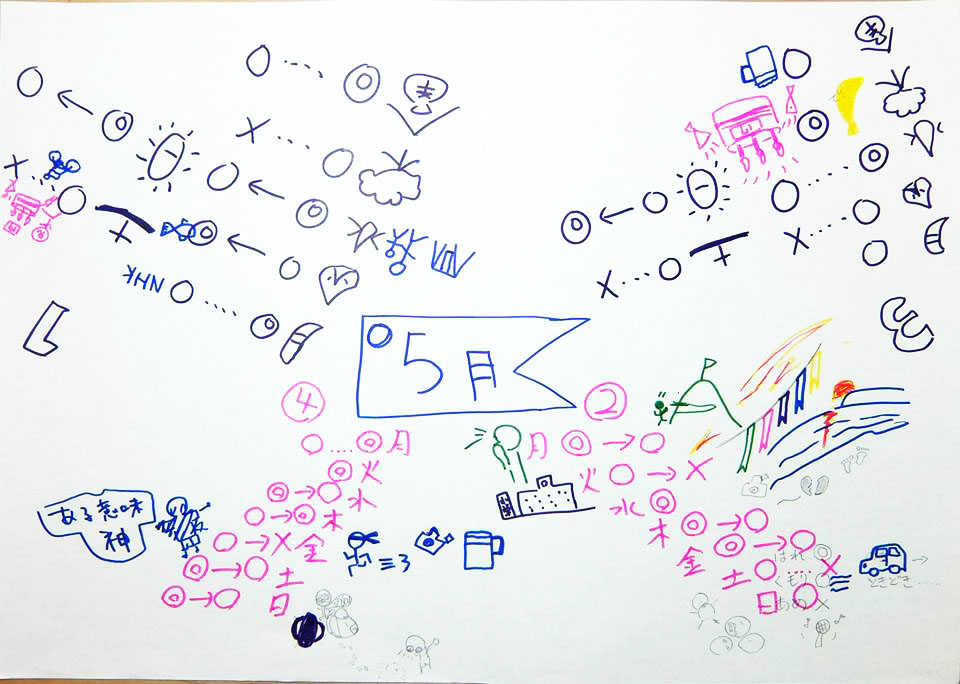
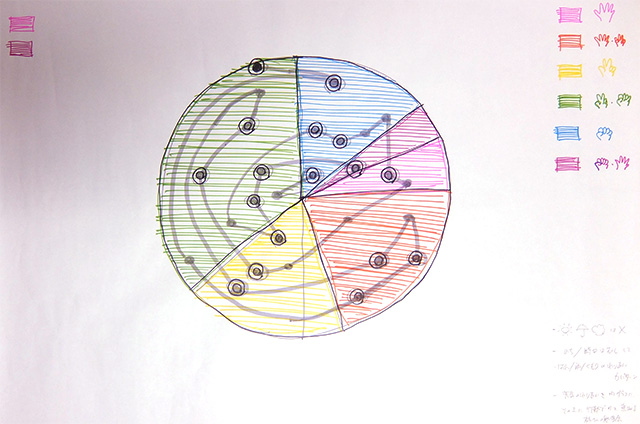
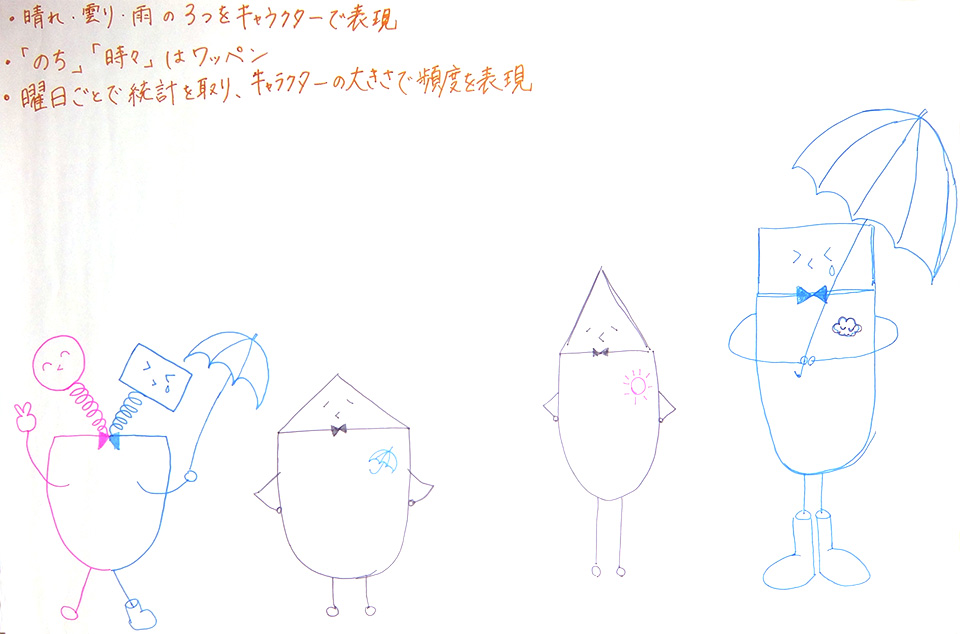
Forget about typical chart/graph formats for a while, Draw a picture in free expression and free coordinate-system, with using the methods of representation of the visual variables. There may be born new charts/graph from here.
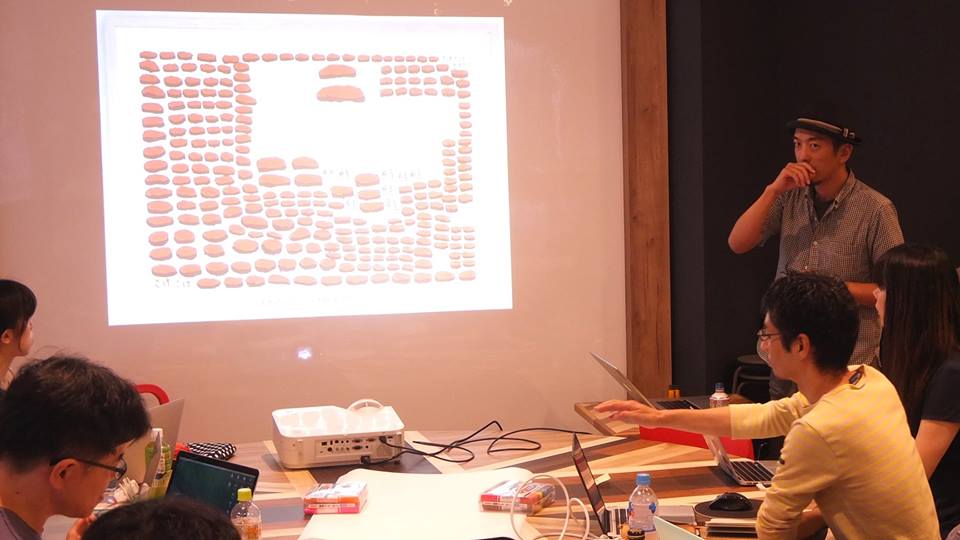
A few excerpts from the slide used at the workshops.

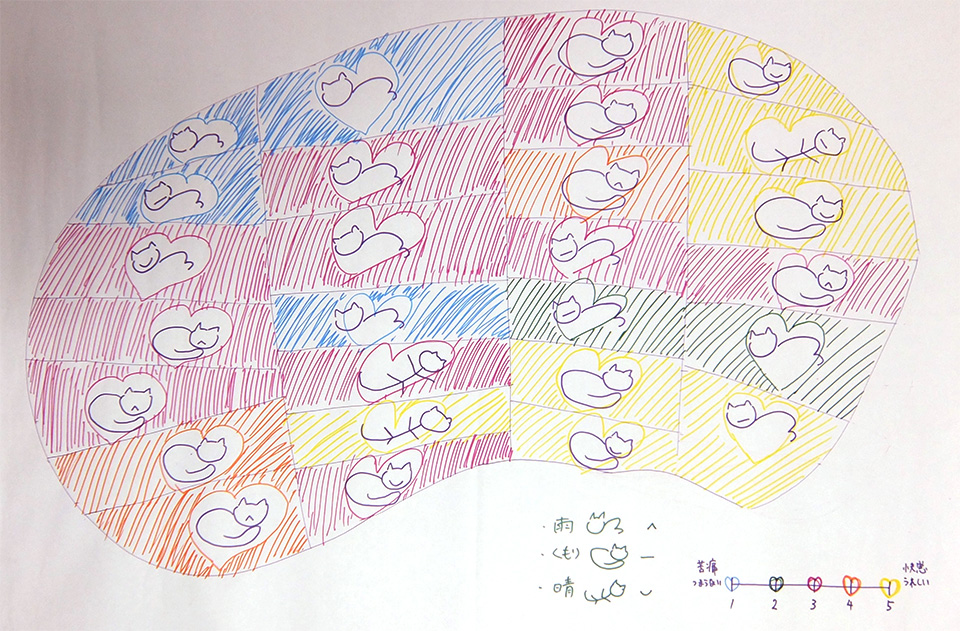
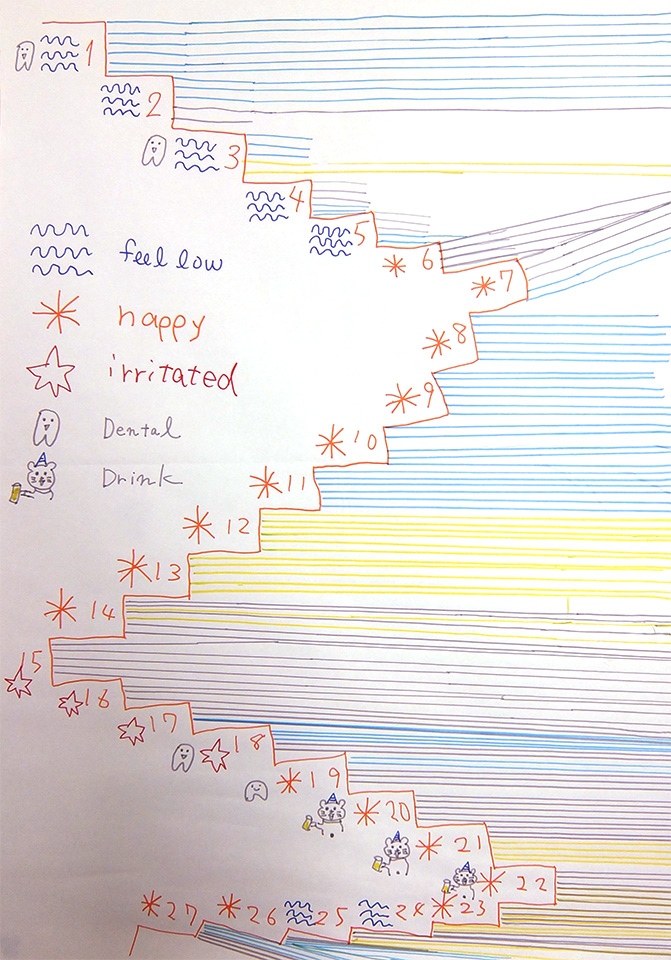
'draw pictures with using the dataset of weather in Tokyo a month and your own activities.'
'draw pictures with using the dataset of weather in Tokyo a month and your own activities.'
This is on-going project. It's gonna be developing more.
I'm gonna publish a book about data visualization from Japanese publisher (in Japanese) and this project's method is gonna feature on it.
with Women Who Code Tokyo, co-hosted by US Embassy. 'Let's use the magic of data visualization and let your favorite music move!'


workshop held at dots.(shared space in Shibuya, Tokyo)

workshop held at 'Shibuya University (NPO)'.